Need some help here.
Our "CCG" prints out monthly reports on the practices in our area. We are assessed on various things like hospital admissions, A&E attendances etc. The information is collated and sorted into funnel graphs like this:
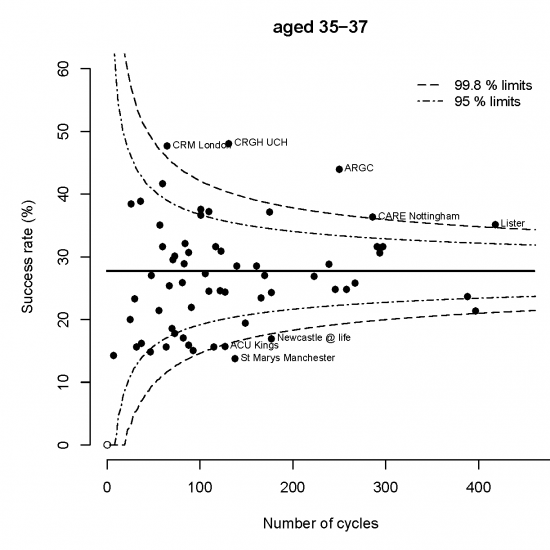
Unfortunately, we don't get to see the raw data unless we're outliers. What I want to do is track our performance over time. It's easy to compare to other practices at that point but not over time. We don't get access to the data. We could do the work ourselves but it's more effort than it's worth.
What I need to be able to do is read off a point from the x-axis and get the data from y. Because the x-axis contains always population numbers, our x-coordinate is always fixed irrespective of the y-plot.
Is there a way to read off the y-axis with software? Or am I stuck with having to use a mouse cursor and MK1 eyeball?